by Lynda Liu, Head of Marketing, Place Exchange
Place Exchange recently released its semi-annual Programmatic OOH Trends Report, analyzing US programmatic OOH spending patterns in H2 2023 compared with H1 2023. Here are some of the key takeaways and drivers behind the growth of programmatic OOH.
Billboards remain the largest single asset category by spend at 38% due to their unmatched reach and effectiveness, and we saw spend on billboards grow steadily throughout the year. We also saw significant growth on place-based inventory, which went from 59% of spend in H1 2023 to 62% in H2 2023. This shows that advertisers are increasingly leveraging the context of different physical environments to reach consumers on their daily journeys between home, work, shopping, and entertainment.
The report also underscores how the growing presence of programmatically-enabled OOH screens gives advertisers from across all verticals more opportunities to engage consumers via an increasingly robust and diverse OOH ecosystem. Overall programmatic screen count on Place Exchange grew by 32% between H1 and H2 2023, driven mainly by new screens in entertainment, retail, transit, and residential locations.
Video OOH comprises over one third of programmatic OOH spend on video-enabled screens, and we expect to see more investment in video over time, especially as advertisers have started to increasingly leverage short-form video content from social campaigns on OOH screens, as evidenced by the growing share of vertical video creatives. We think growth is also driven by advertisers increasingly realizing that the abundance of OOH CTV screens available across retail, entertainment, transit and other venues, offer premium programmed content, high levels of consumer attention, massive reach, and audience-based targeting – all at lower CPMs than other video media, and guaranteed to be brand safe, viewable and bot free.
While still a small percentage of overall programmatic OOH, we saw a large relative increase in Programmatic Guaranteed transactions, whereby buyers are able to extract the myriad benefits of programmatic buying – automation, flexibility, advanced targeting, full-funnel measurement, and more – on direct-sold OOH inventory.
Additional takeaways from the report:
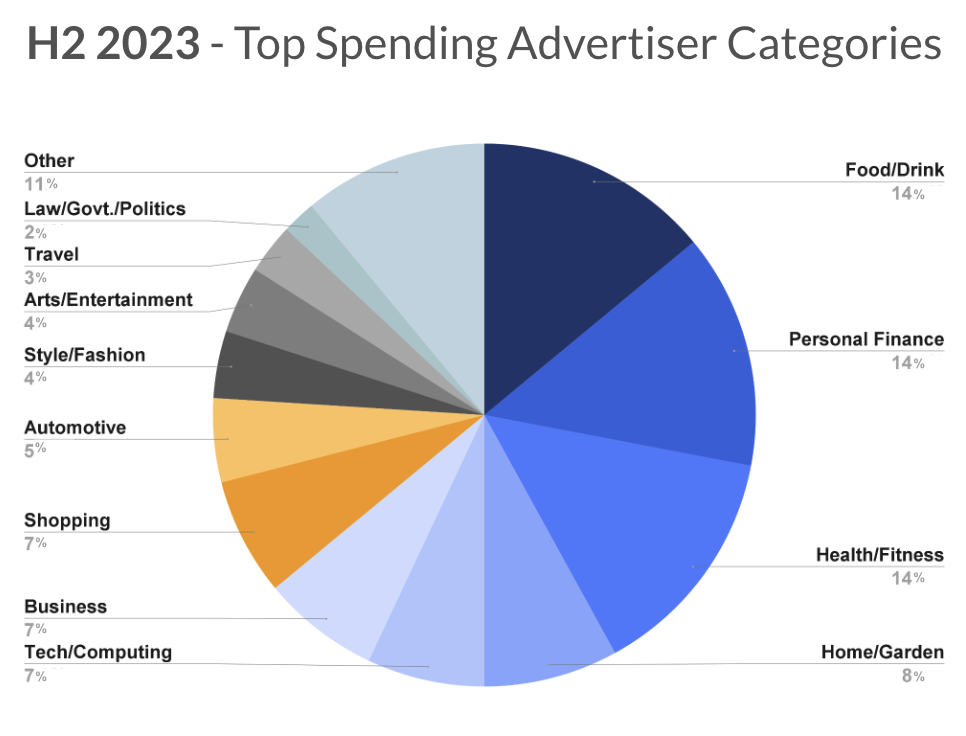
- From H1 2023 to H2 2023, the top 3 programmatic OOH advertising categories remained the same (Food/Drink, Personal Finance, and Health/Fitness) and accounted for almost half of spend. In both time periods, the other half of spend was balanced across a broad mix of categories, with some notable gains and declines in different categories.
- The fastest-growing categories were Home/Garden, Business, Automotive, Shopping, Tech/Computing, and Health/Fitness.
- Outdoor remained the largest venue category, with 55% of spend, followed by Retail at 15%, Transit at 10%, and Entertainment at 8%.
- The average CPM for programmatic OOH inventory was $7.24 in H2 2023, a slight increase from the $7.17 average in H1 2023. CPMs by venue category were relatively stable.
- While programmatic OOH supports a wide variety of creative formats, the majority of spending remained concentrated in a few formats:
- 76% of programmatic Video OOH ads were 15 seconds in length, a slight increase from the prior period.
- 84% of programmatic OOH video spend is attributed to the top 2 sizes (WxH): 1920×1080 and 1080×1920.
- While 50% of programmatic OOH video spend is on horizontal video formats, vertical video formats are growing in share.
- 84% of programmatic OOH display spend on static display creatives is attributed to the top 3 ad sizes (WxH): 1400×400, 1920×1080, 1080×1920.
- Programmatic OOH continues to transact predominantly via Private Marketplace (PMP) deals, representing 93% of H2 2023 spend, given the high levels of campaign flexibility, price transparency, and media quality offered to buyers. While Custom PMPs represent the majority of spend, Always-on Deals and Programmatic Guaranteed Deals both gained relative share.
Download the full report here.
Published: February 9, 2024
